Inspecting Traffic
Real-time HTTP Request & Response Monitoring
Learn how to use wsgrok's powerful HTTP Inspector to debug, analyze, and replay requests flowing through your tunnels.
Table of Contents
1. Inspector Overview
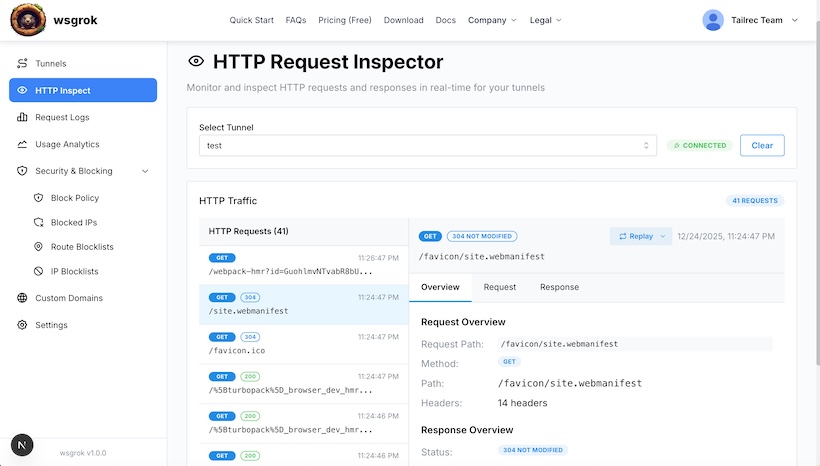
The wsgrok HTTP Inspector provides a real-time, comprehensive view of all HTTP requests and responses flowing through your active tunnels. It's an indispensable tool for debugging webhooks, APIs, and web applications.
Why Use the Inspector?
- Debug misconfigured webhooks in real-time.
- Analyze API requests and responses to understand data flow.
- Verify expected headers, body content, and status codes.
- Identify unexpected traffic or potential security issues.
2. Key Features
The HTTP Inspector comes packed with features designed to streamline your debugging workflow:
Real-time Monitoring
See requests appear instantly as they hit your tunnel. No need to refresh or wait.
Detailed Request/Response View
Drill down into every aspect of an HTTP exchange: headers, query parameters, form data, JSON bodies, cookies, and more.
Request Replay
Resend any captured request with a single click. Perfect for re-testing webhook payloads or API calls.
Modify & Replay
Edit any part of a captured request (URL, headers, body) before replaying it. This allows for rapid iteration and testing of edge cases.
3. How to Use
Follow these simple steps to start inspecting your traffic:
Step 1: Start Your Tunnel
Ensure your wsgrok client is running and a tunnel is active. For example:
wsgrok 3000 my-dev-app
Step 2: Access the Inspector
- Log in to the wsgrok Console.
- Navigate to the HTTP Inspect section or directly visit /console/inspect.
- Select the tunnel you wish to inspect from the dropdown menu.
Requests will begin appearing in real-time as they pass through your chosen tunnel.
4. Advanced Usage: Replay & Modify Requests
The ability to replay and modify requests is incredibly powerful for testing and debugging.
Replaying a Request
- Click on a captured request in the history.
- Locate the Replay button.
- The request will be re-sent through the tunnel to your local service.
Modifying a Request
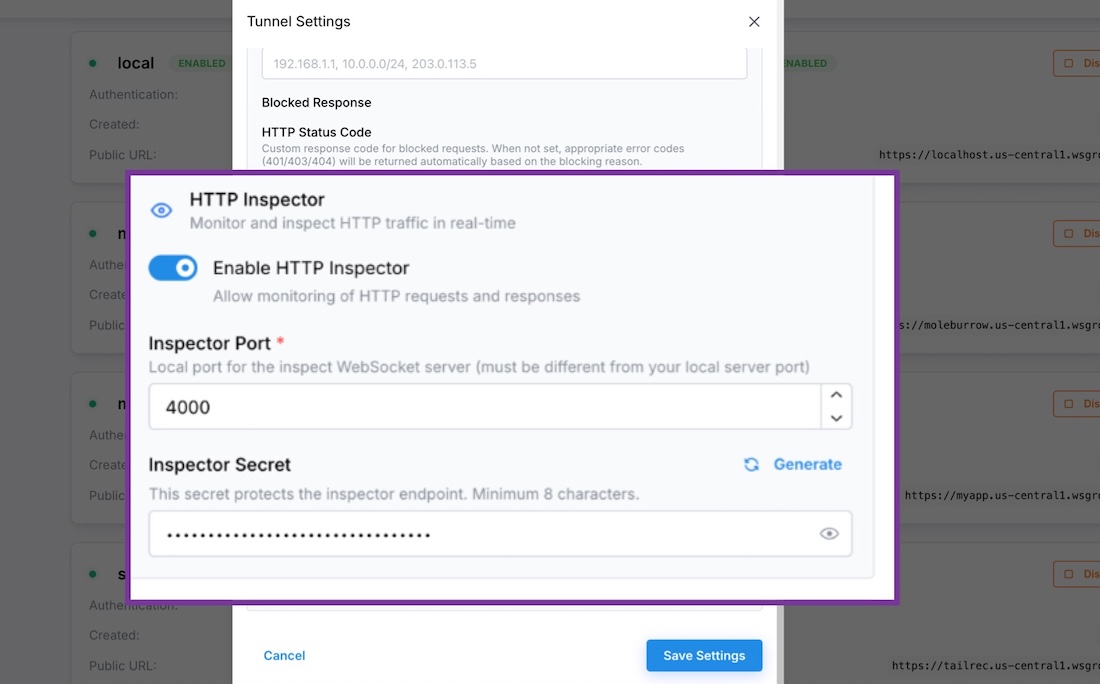
- After selecting a request, expand the "Request Details" panel.
- Edit the URL, headers, or body content directly in the provided editor.
- Click the Replay button to send your modified request.
This is ideal for testing different input scenarios or fixing minor errors without needing to re-trigger the request from the original source.
Screenshot: Request Details and Replay Controls
Summary
The wsgrok HTTP Inspector transforms debugging your local web services by providing unparalleled visibility and control over your traffic.
Ready to secure your tunnels?
Explore Security Configuration